Console Status Indicators
When you start PROLIN Smart Client, the console is automatically displayed. This console is your main workspace, where you analyze, find, and update information in various items—such as Service Calls, Incidents, Problems, and more.
As you work within the console, your actions become part of the IT processes defined by your organization. PROLIN Smart Client ensures adherence to these procedures, helping you remain compliant and efficient.
📌 Console Overview
The console is the starting point of your work. Here’s how it’s structured:
🪟 View Window
- Located at the center of the console.
- Displays a view of items (e.g., incidents, service calls).
- This is where the core of your item-based work occurs.
🧭 Ribbon and Application Icon
- Found above the view window.
- The ribbon includes tabs, and each tab contains commands.
Ribbon Tabs:
Home Tab:
Includes general commands likePrintandAdvanced Find.View Tab:
Allows customization of the view configuration.
🧰 Action Windows
- Located to the left, right, and bottom of the view window.
- These contain frequently used tools to support your workflow.
Some examples:
- Navigators
- Attachment managers
- Other context-specific tools
📐 Layout Notes
- The view window always remains in the center.
- Scrolling action windows are positioned to the outside of pinned action windows, making navigation intuitive and efficient.
🖼️ The image below visually labels all parts of the console.
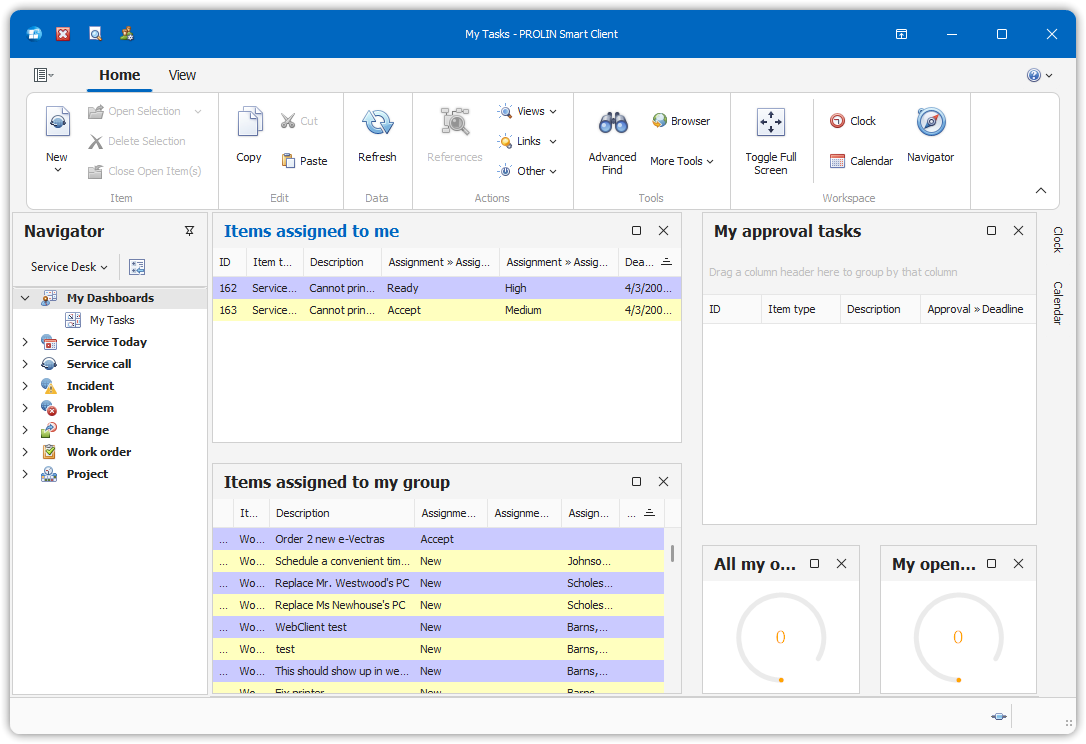
The structure of the console is designed to help you stay organized, efficient, and aligned with your ITIL-based processes.
Console Status Indicators
The status indicators in the lower corners of the PROLIN Smart Client console provide important feedback about connection status and view activity.
🔽 Lower Right Corner — Connection Status
This area shows the status of the Smart Client’s connection to the Service Desk server.
✅ Connected
- A moving indicator shows that the client is working (e.g., retrieving information).

- Once idle, the indicator disappears, indicating the client is ready.
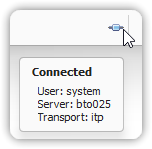
- Hovering over the connection icon shows:
- The username
- The server name currently connected to
❌ Not Connected
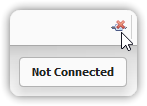
- A red connection indicator means the client is disconnected.
- PROLIN Smart Client will attempt to automatically reconnect.
- Once reconnected, the indicator returns to normal.
🔽 Lower Left Corner — Item View & Selection Status
This area provides details about the items shown and selections made in the current view.
🔄 Working

- The text “Working” means the client is searching for items.
- This may take time if a large dataset is being retrieved.
📄 No Selection

- The view has finished loading items.
- The total number of items shown is displayed.
- If results exceed view height, scrollbars will appear.
- The number of results will not exceed the query restriction for your account.
✔️ Items Selected
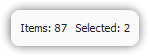
- If you select one or more items, the lower left corner shows the number of selected items.
- This remains visible even if selected items span outside the visible portion of the view.
These indicators help users understand the current state of the application, whether it’s retrieving data, disconnected, or responding to user interactions.