Parts of a View
Views in PROLIN Smart Client provide an overview of various types of items, such as Service Calls, Problems, Changes, etc. Each view is designed to serve a specific purpose in your workflow.
Available Views
- MyTasks View – Shows all tasks and items assigned to you.
- Service Today View – Displays all items available for assignment.
- Table View – Lists items in tabular format.
- Explorer View – Provides hierarchical navigation and filtering.
- Tree View – Visualizes items in a structured hierarchy.
- Chart View – Displays aggregated data as visual charts.
- Configuration Item Structure View – Shows configuration items and their relationships.
- Scheduler View – Displays Projects, Changes, and Work Orders in a timeline format.
🔎 See also: Finding and Opening a View
MyTasks View
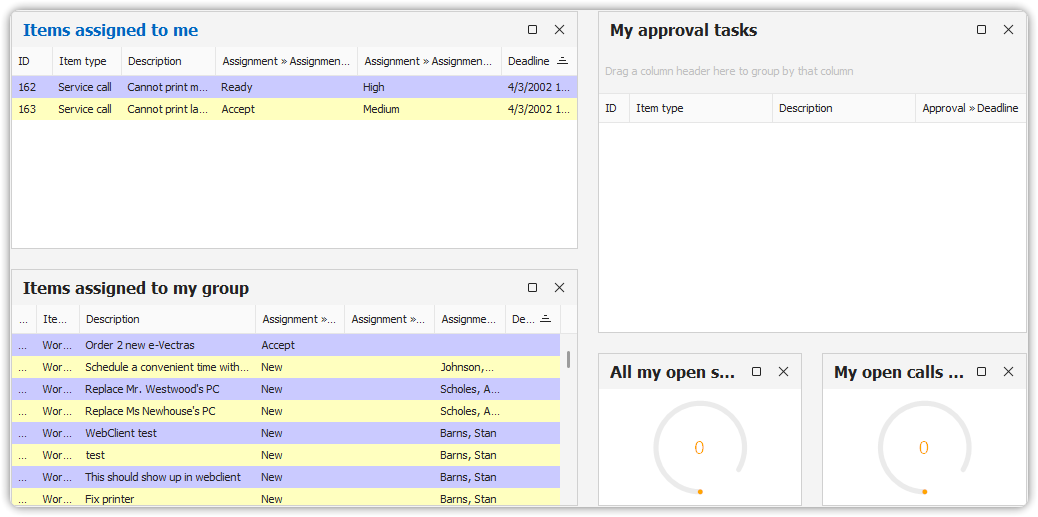
The MyTasks View is a perfect starting point for your workday. It shows all tasks and items that are specifically assigned to you.
📌 See: Working With My Tasks
Service Today View
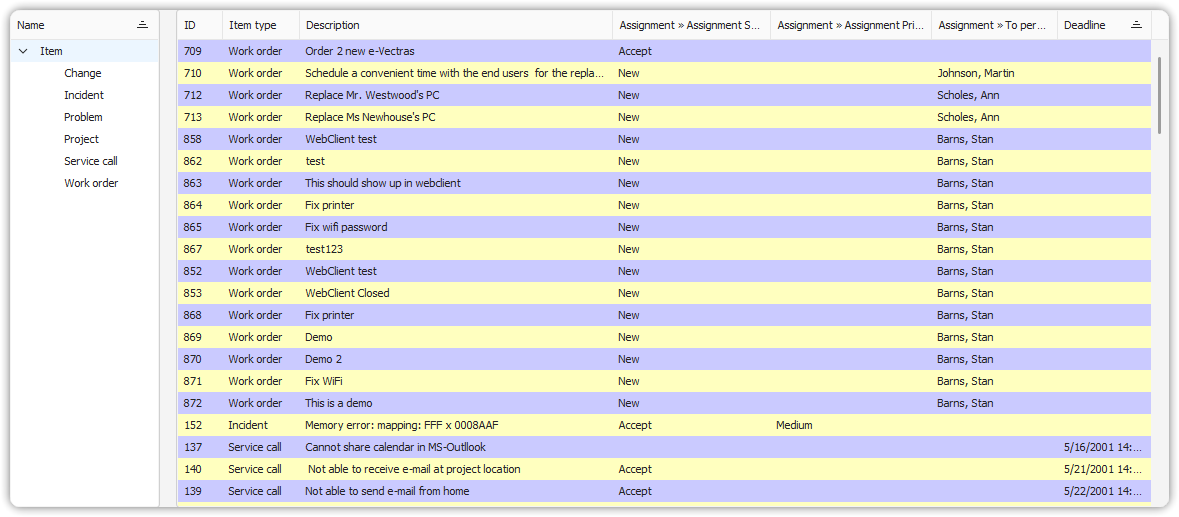
The Service Today View lists all items that can be assigned to a person or workgroup. These include:
- Service Calls
- Incidents
- Problems
- Changes
- Work Orders
This view uses either a table or explorer layout. An Item Type column indicates the type of each item. When an item is opened, the appropriate form (e.g., Incident Form, Work Order Form) is displayed.
🛠️ You cannot change the Item Type field.
📌 See: Working With Service Today
Table View
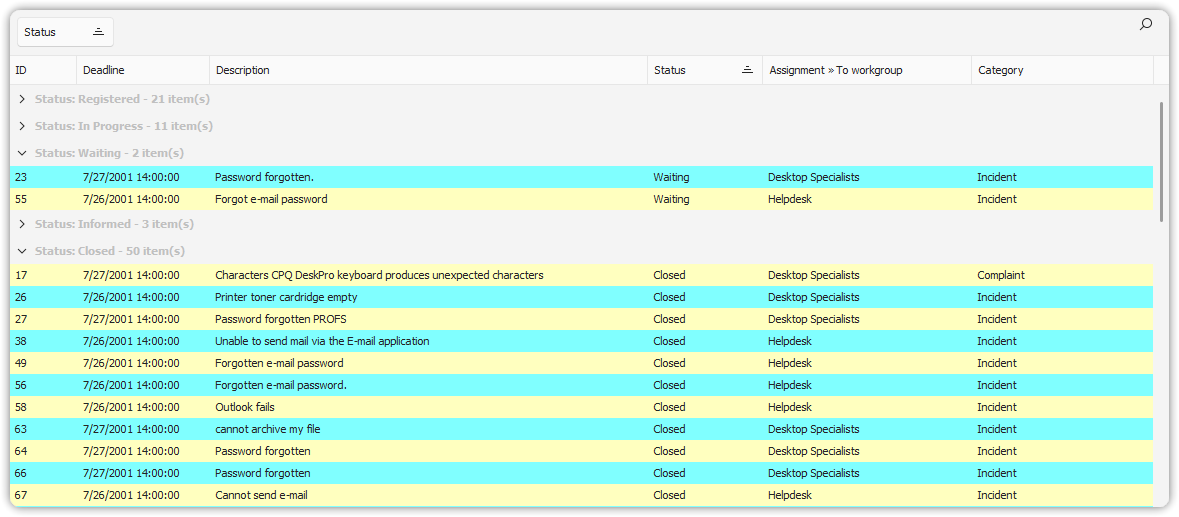
The Table View presents items in a simple list format. It is commonly used to:
- View a list of items
- Access key item information
- Open items in a form to view or edit details
This view is often embedded in other views such as MyTasks and Explorer.
Explorer View
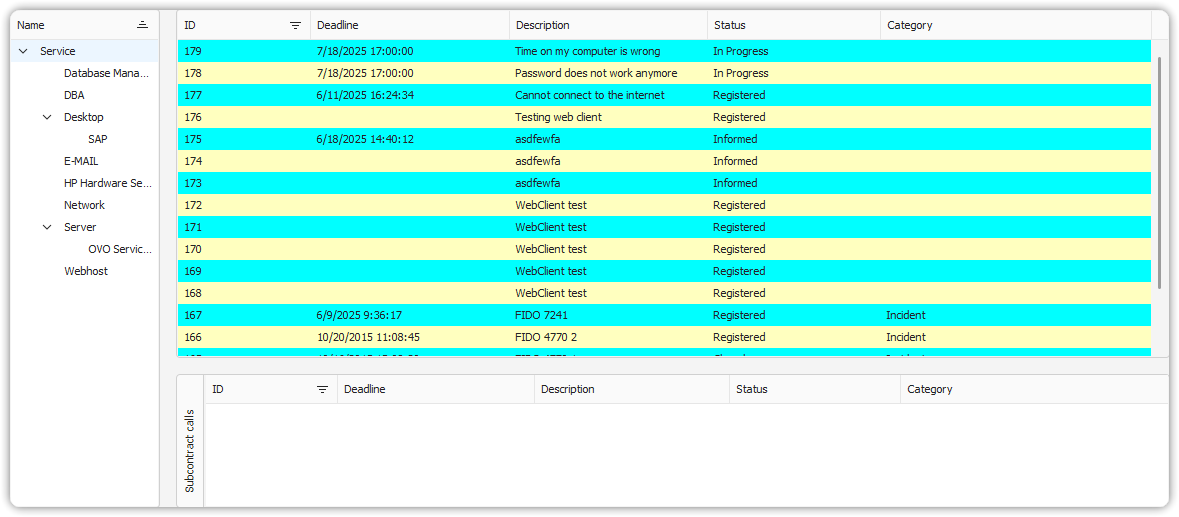
The Explorer View enhances navigation through records using field values. It includes:
- A navigation pane with filter criteria
- A base view of filtered items
- One or more detail views showing related records
Tree View
The Tree View organizes items into a hierarchical structure. Similar to a tree diagram:
- The root node is at the top (e.g., a company).
- Branches represent divisions, regions, and departments.
- Leaf nodes represent items with no children.
This view is useful for modeling structured data like organizational hierarchies.
📌 See: Navigating Trees
Chart View
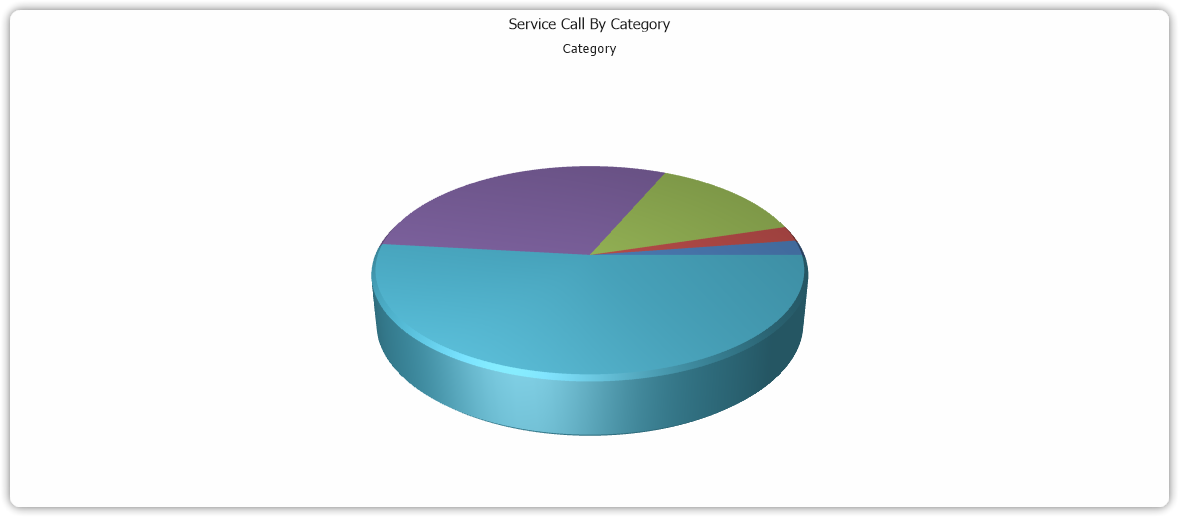
The Chart View provides visual summaries of data:
- Use 3D charts for presentations.
- Use 2D charts for interactive analysis.
You can export charts to image formats and include them in reports or presentations.
📌 See: Running Reports 📌 See: Drilling Down In A Chart
Configuration Item Structure View
This view visualizes Configuration Items (CIs) and their relationships. It allows you to explore dependencies and system architecture using various layout options.
It is especially helpful in:
- Impact analysis
- Understanding dependencies between hardware, software, and services
Network View
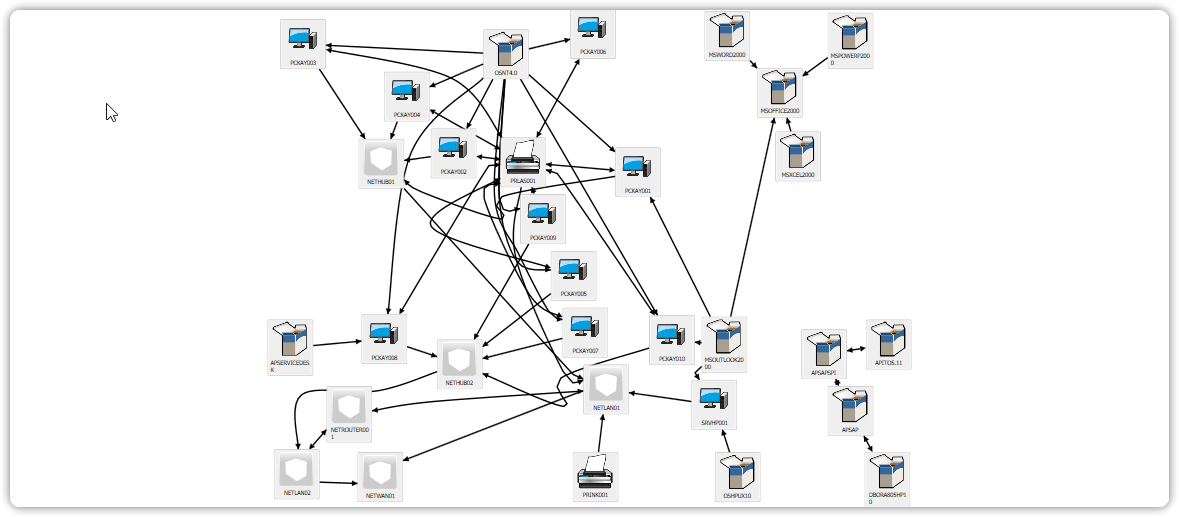
The Network View graphically represents parent-child relationships between Configuration Items (CIs).
- Arrows indicate relationships: from parent to child
- This view is based on logical or functional connections, not necessarily physical networks
Use this view to assess:
- Software-to-OS dependencies
- Change impacts across infrastructure
Scheduler View
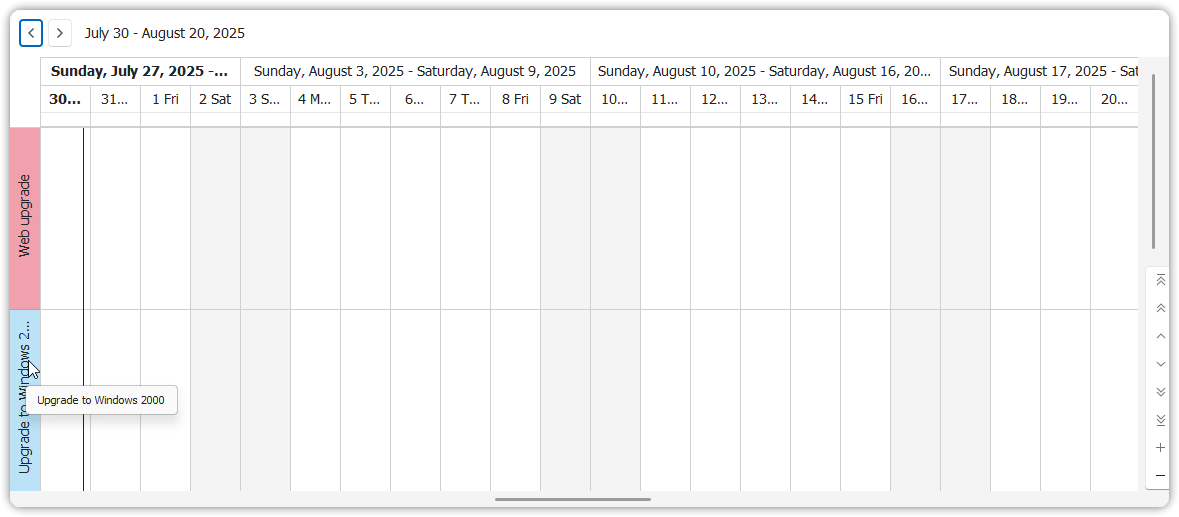
The Scheduler View presents Projects, Changes, and Work Orders in a timeline (project-style) format.
Features:
- Scroll through time
- Use search to find items
- Double-click to open a planned item
This view is useful for planning and managing multiple overlapping efforts.
Each of these views supports a specific aspect of ITIL processes and helps you engage with complex data more effectively.