Table Report
This tutorial describes how to create a table report, where the report’s data is arranged in a tabular format.
> ⚠️ Do not confuse this with master-detail reports or cross-tab reports—those are different structures.
Steps to Create a Table Report
1. Insert a Page Header Band
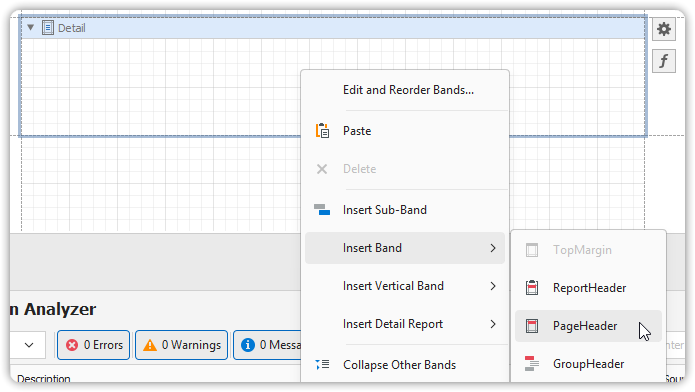
To add a Page Header:
- Right-click anywhere on the report surface.
- In the context menu, select:
Insert Band → Page Header
2. Add Table Controls
Add two Table controls to the report:
- One in the Page Header (for column titles)
- One in the Detail band (for actual data)
To add tables:
- In the Toolbox, click the Table icon.
- In the Page Header, click and drag across the band to draw the table.
- Repeat in the Detail band.
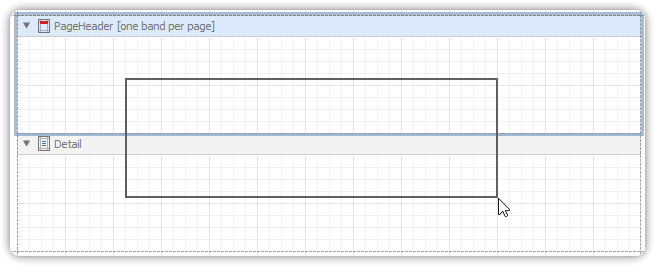
🧱 You’ll now have two tables:
- Header Table (in Page Header band)
- Detail Table (in Detail band)
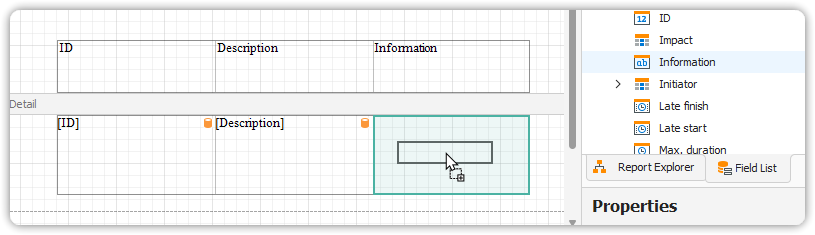
3. Define Table Headers and Bind Data
- Type your column titles into the header table cells.
- Bind each cell in the detail table to a data field:
- Drag fields from the Field List and drop them onto the appropriate table cells.
4. Customize Table Appearance
Use the Property Grid and Formatting Toolbar to style your tables:
- Set Borders
- Set Background Color
- Customize text formatting (font, alignment, etc.)
🎨 You can also define Odd-Even styles for the Detail Table to improve readability.
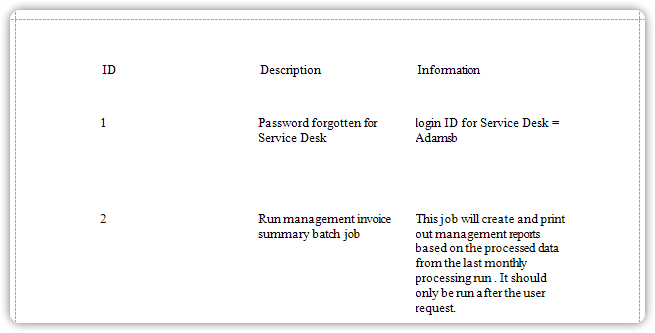
This creates a structured and styled table report that displays data in a clear, professional format.